

In Exercises 13 through 16, modify the least-squares procedure as illustrated in Example 7.4.4 to find a
Question:
In Exercises 13 through 16, modify the least-squares procedure as illustrated in Example 7.4.4 to find a curve of the form y = Aemx that best fits the given data.
(5, 9.3), (10, 10.8), (15, 12.5), (20, 14.6), (25, 17)
Data from Example 7.4.4.
A manufacturer gathers these data relating the level of production x (hundred units) of a particular commodity to the demand price p (dollars per unit) at which all x units will be sold:
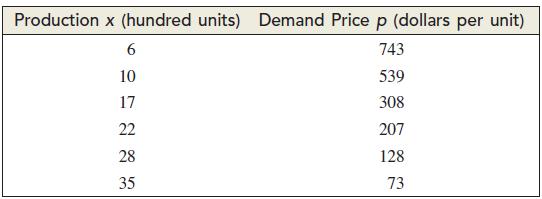
a. Plot a scatter diagram for the data on a graph with production level on the x axis and demand price on the y axis.
b. Notice that the scatter diagram in part (a) suggests that the demand function is exponential. Modify the least-squares procedure to find a curve of the form p = Aemx that best fits the data in the table.
c. Use the exponential demand function you found in part (b) to predict the revenue the manufacturer should expect if 4,000 (x = 40) units are produced.
Step by Step Answer:
For the x z data and so m 003 and b 208 For ...View the full answer


Calculus For Business, Economics And The Social And Life Sciences
ISBN: 9780073532387
11th Brief Edition
Authors: Laurence Hoffmann, Gerald Bradley, David Sobecki, Michael Price
