

Listed in the table below are the estimated 2018 populations (in millions) and the 2018 salary of
Question:
Listed in the table below are the estimated 2018 populations (in millions) and the 2018 salary of the governor (in thousands of dollars) for ten randomly selected states.
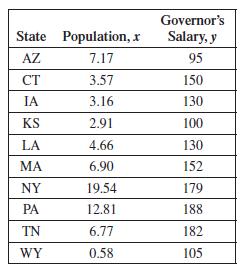
(a) Find the correlation coefficient. Do the data seem to fit a straight line?
(b) Draw a scatterplot of the data. Compare this with your answer from part (a).
(c) Find the equation for the least squares line.
(d) Based on your answer to part (c), how much does a governor’s salary increase, on average, for each additional million in population?
Fantastic news! We've Found the answer you've been seeking!
Step by Step Answer:
a Using a graphing calculator r 06683 The data seem to f...View the full answer

Answered By
Bhartendu Goyal
Professional, Experienced, and Expert tutor who will provide speedy and to-the-point solutions. I have been teaching students for 5 years now in different subjects and it's truly been one of the most rewarding experiences of my life. I have also done one-to-one tutoring with 100+ students and help them achieve great subject knowledge. I have expertise in computer subjects like C++, C, Java, and Python programming and other computer Science related fields. Many of my student's parents message me that your lessons improved their children's grades and this is the best only thing you want as a tea...
2+ Reviews
10+ Question Solved
Related Book For 

Question Posted:
