

The accompanying graph represents a function f (x) that oscillates between 1 and 1 more and more
Question:
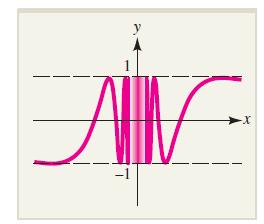
The accompanying graph represents a function f (x) that oscillates between 1 and −1 more and more frequently as x approaches 0 from either the right or the left. Does
![]()
exist? If so, what is its value?
Fantastic news! We've Found the answer you've been seeking!
Step by Step Answer:
Does not exist because f...View the full answer

Answered By
Pushpinder Singh
Currently, I am PhD scholar with Indian Statistical problem, working in applied statistics and real life data problems. I have done several projects in Statistics especially Time Series data analysis, Regression Techniques.
I am Master in Statistics from Indian Institute of Technology, Kanpur.
I have been teaching students for various University entrance exams and passing grades in Graduation and Post-Graduation.I have expertise in solving problems in Statistics for more than 2 years now.I am a subject expert in Statistics with Assignmentpedia.com.
3+ Reviews
10+ Question Solved
Related Book For 

Calculus For Business, Economics And The Social And Life Sciences
ISBN: 9780073532387
11th Brief Edition
Authors: Laurence Hoffmann, Gerald Bradley, David Sobecki, Michael Price
Question Posted:
