

The accompanying graph shows how a population P of fruit flies (Drosophila) changes with time t (days)
Question:
The accompanying graph shows how a population P of fruit flies (Drosophila) changes with time t (days) during an experiment. Use the graph to estimate the rate at which the population is growing after 20 days and also after 36 days. At what time is the population growing at the greatest rate?
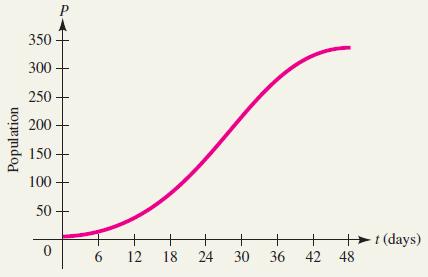
Growth curve for a population of fruit flies.
Fantastic news! We've Found the answer you've been seeking!
Step by Step Answer:
Drawing a tangent line at each of the indicated poin...View the full answer

Answered By
Ishrat Khan
Previously, I have worked as an accounting scholar at acemyhomework, and have been tutoring busines students in various subjects, mostly accounting. More specifically I'm very knowledgeable in accounting subjects for college and university level. I have done master in commerce specialising in accounting and finance as well as other business subjects.
134+ Reviews
426+ Question Solved
Related Book For 

Calculus For Business, Economics And The Social And Life Sciences
ISBN: 9780073532387
11th Brief Edition
Authors: Laurence Hoffmann, Gerald Bradley, David Sobecki, Michael Price
Question Posted:
