

The accompanying graph shows the amount of gasoline in the tank of a car over a 30-day
Question:
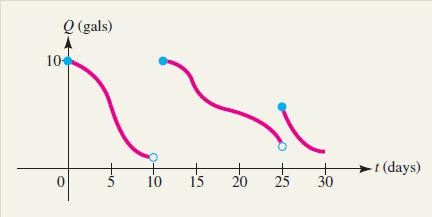
The accompanying graph shows the amount of gasoline in the tank of a car over a 30-day period. When is the graph discontinuous? What do you think happens at these times?
Fantastic news! We've Found the answer you've been seeking!
Step by Step Answer:
The graph is discon...View the full answer

Answered By
OTIENO OBADO
I have a vast experience in teaching, mentoring and tutoring. I handle student concerns diligently and my academic background is undeniably aesthetic
3+ Reviews
10+ Question Solved
Related Book For 

Calculus For Business, Economics And The Social And Life Sciences
ISBN: 9780073532387
11th Brief Edition
Authors: Laurence Hoffmann, Gerald Bradley, David Sobecki, Michael Price
Question Posted:
