

The accompanying table gives the U.S. decennial census figures (in millions) for the period 19502000: a. Find
Question:
The accompanying table gives the U.S. decennial census figures (in millions) for the period 1950–2000:
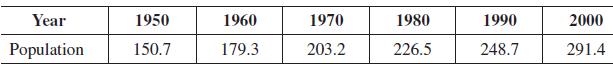
a. Find the least-squares line y = mt + b for these data, where y is the U.S.population t decades after 1950.
b. Use the least-squares line found in part (a) to predict the U.S. population for the year 2010. Use the Internet to find the actual U.S. population in 2010 and compare with the predicted value.
Fantastic news! We've Found the answer you've been seeking!
Step by Step Answer:
a The data set to be fit is 0 1507 1 1793 2 2032 3 2265 4 2487 and 5 2914 Fo...View the full answer

Answered By
Fahmin Arakkal
Tutoring and Contributing expert question and answers to teachers and students.
Primarily oversees the Heat and Mass Transfer contents presented on websites and blogs.
Responsible for Creating, Editing, Updating all contents related Chemical Engineering in
latex language
8+ Reviews
22+ Question Solved
Related Book For 

Calculus For Business, Economics And The Social And Life Sciences
ISBN: 9780073532387
11th Brief Edition
Authors: Laurence Hoffmann, Gerald Bradley, David Sobecki, Michael Price
Question Posted:
