

The figure shows estimated totals of nuclear weapons inventory for the United States and the Soviet Union
Question:
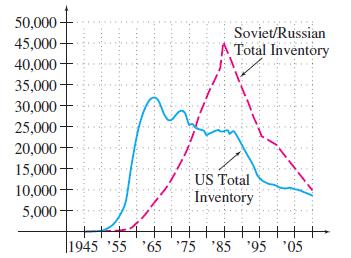
The figure shows estimated totals of nuclear weapons inventory for the United States and the Soviet Union (and its successor states) from 1945 to 2010.
a. On what intervals were the total inventories of both countries increasing?
b. On what intervals were the total inventories of both countries decreasing?
Fantastic news! We've Found the answer you've been seeking!
Step by Step Answer:
The graph shows the totals nuclear weapons inventory for the United States and the So...View the full answer

Answered By
Kanapaka Venkatakrishna
As a former assistant professor in mechanical engineering, my education and tutoring experience would typically include the following:
Education Experience:
Bachelor's Degree: I have completed a bachelor's degree in mechanical engineering as the foundational step in my academic journey.
Master's Degree: After completing my bachelor's degree, I pursued a master's degree in mechanical engineering or a specialized area within the field. This degree provided me with more in-depth knowledge and research experience.
Ph.D. in Biomechanical Engineering: As an assistant professor, I have earned a Ph.D. in mechanical engineering. My Ph.D. involved several years of advanced study, original research, and the successful defense of a doctoral dissertation. This terminal degree qualifies you to teach at the university level and conduct independent research.
Teaching and Tutoring Experience:
Teaching Assistant (TA) Experience: During your graduate studies, I likely served as a teaching assistant (TA) for undergraduate courses. As a TA, I assisted professors in conducting lectures, grading assignments, and supporting students.
Part-Time Teaching Positions: Before becoming an assistant professor, I worked as a part-time instructor or adjunct faculty member at universities or colleges in India. These positions allowed me to gain valuable teaching experience and expand my academic portfolio.
Tutoring and Academic Workshops: As an aspiring assistant professor, I may have offered tutoring services or conducted academic workshops for undergraduate students. This experience helped me develop effective teaching methodologies and create a positive learning environment.
Teaching at the Assistant Professor Level: As an assistant professor, I engaged in teaching undergraduate and possibly graduate-level courses in mechanical engineering. I was responsible for designing course materials, delivering lectures, conducting labs, and assessing student performance.
Overall, my education and tutoring experience as an assistant professor demonstrates my expertise in mechanical engineering and my commitment to sharing knowledge with students and aspiring engineers. As I progress in your academic career, I will continue to refine my teaching abilities, conduct research, publish papers, and contribute to the advancement of mechanical engineering knowledge.
0 Reviews
10+ Question Solved
Related Book For 

Calculus With Applications
ISBN: 9780321831101
10th Edition
Authors: Margaret L Lial, Raymond N Greenwell, Nathan P Ritchey
Question Posted:
