

The following chart shows how the percentage of eighth graders, tenth graders, and twelfth graders who have
Question:
The following chart shows how the percentage of eighth graders, tenth graders, and twelfth graders who have used marijuana in their lifetime has varied in recent years.
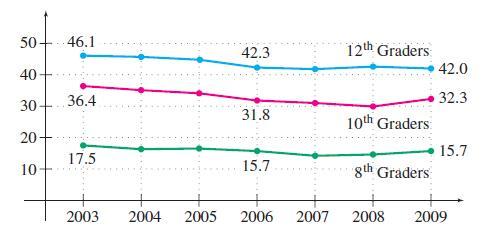
a. Find the average annual rate of change in the percent of eighth graders who have used marijuana in their lifetime over the three-year period 2003–2006 and the three-year period 2006–2009. Then calculate the annual rate of change for 2003–2009.
b. Repeat part a for tenth graders.
c. Repeat part a for twelfth graders.
d. Discuss any similarities and differences between your answers to parts a through c, as well as possible reasons for these differences and similarities.
Step by Step Answer:
To calculate the average annual rate of change in the percentage of students who have used marijuana in their lifetime over different periods well use ...View the full answer


Calculus With Applications
ISBN: 9780321831101
10th Edition
Authors: Margaret L Lial, Raymond N Greenwell, Nathan P Ritchey
