

The following graph shows the number of vehicles per hour crossing the Tappan Zee Bridge, which spans
Question:
The following graph shows the number of vehicles per hour crossing the Tappan Zee Bridge, which spans the Hudson River north of New York City. The graph shows the number of vehicles traveling eastbound (into the city) and westbound (out of the city) as a function of time.
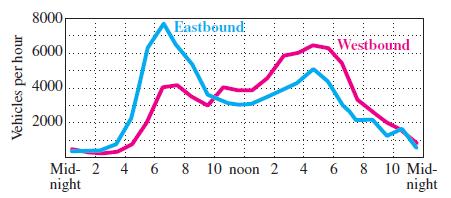
a. Using midpoints on intervals of one hour, estimate the total number of vehicles that cross the bridge going eastbound each day.
b. Repeat the instructions for part a for vehicles going westbound.
c. Discuss whether the answers to parts a and b should be equal, and try to explain any discrepancies.
Fantastic news! We've Found the answer you've been seeking!
Step by Step Answer:
To estimate the total number of vehicles that cross the Tappan Zee Bridge going eastbound and westbound each day using midpoints on intervals of one h...View the full answer

Answered By
Deepak Sharma
0 Reviews
10+ Question Solved
Related Book For 

Calculus With Applications
ISBN: 9780321831101
10th Edition
Authors: Margaret L Lial, Raymond N Greenwell, Nathan P Ritchey
Question Posted:
