

The following table lists how poverty level income cutoffs (in dollars) for a family of four have
Question:
The following table lists how poverty level income cutoffs (in dollars) for a family of four have changed over time. 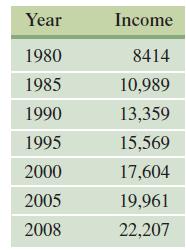
Let x represent the year, with x = 0 corresponding to 1980 and y represent the income in thousands of dollars.
a. Plot the data. Do the data appear to lie along a straight line?
b. Calculate the correlation coefficient. Does your result agree with your answer to part a?
c. Find the equation of the least squares line.
d. Use your answer from part c to predict the poverty level in the year 2018.
Fantastic news! We've Found the answer you've been seeking!
Step by Step Answer:
a The data appear to ...View the full answer

Answered By
Carly Cimino
As a tutor, my focus is to help communicate and break down difficult concepts in a way that allows students greater accessibility and comprehension to their course material. I love helping others develop a sense of personal confidence and curiosity, and I'm looking forward to the chance to interact and work with you professionally and better your academic grades.
12+ Reviews
21+ Question Solved
Related Book For 

Calculus With Applications
ISBN: 9780321831101
10th Edition
Authors: Margaret L Lial, Raymond N Greenwell, Nathan P Ritchey
Question Posted:
