

The following table shows the number of new jobs gained per year in the private sector in
Question:
The following table shows the number of new jobs gained per year in the private sector in the U.S. in recent years.
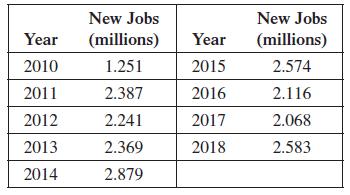
(a) Find an equation for the least squares line, letting x be the number of years since 2000.
(b) Find the correlation coefficient for these data.
(c) Sketch a scatterplot of these data, and include the least squares line in the graph.
Fantastic news! We've Found the answer you've been seeking!
Step by Step Answer:
a b c 2 y 1 10 1251 1251 100 11 2387 26257 121 12 2241 ...View the full answer

Answered By
Muhammad Umair
I have done job as Embedded System Engineer for just four months but after it i have decided to open my own lab and to work on projects that i can launch my own product in market. I work on different softwares like Proteus, Mikroc to program Embedded Systems. My basic work is on Embedded Systems. I have skills in Autocad, Proteus, C++, C programming and i love to share these skills to other to enhance my knowledge too.
1+ Reviews
10+ Question Solved
Related Book For 

Question Posted:
