

The following table shows the seasonally adjusted unemployment rate in the U.S. in recent years. (a) Find
Question:
The following table shows the seasonally adjusted unemployment rate in the U.S. in recent years.
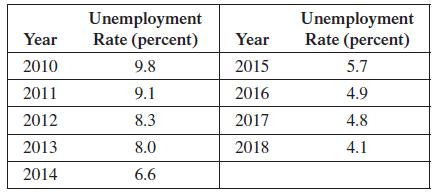
(a) Find the least squares line through these data, letting x be the number of years since 2000.
(b) Find the correlation coefficient for these data.
(c) Sketch a scatterplot of these data, and include the least squares line in the graph.
Fantastic news! We've Found the answer you've been seeking!
Step by Step Answer:
a b c X 10 98 11 91 12 83 13 80 104 14 6...View the full answer

Answered By
Anum Naz
Lecturer and researcher with 10+ years of experience teaching courses in both undergraduate and postgraduate levels. Supervised 17 BA theses, 07 MA theses, and 1 Ph.D. dissertations. Edited and co-authored 2 monographs on contemporary trends in political thought. Published over articles in peer-reviewed journals.
11+ Reviews
51+ Question Solved
Related Book For 

Question Posted:
