

The graph below shows recent values (in billions of dollars per year) of the U.S. deficit, which
Question:
The graph below shows recent values (in billions of dollars per year) of the U.S. deficit, which gives the rate that the U.S. debt accumulates. Use rectangles of width 2 years and height determined by the function value at the midpoint to estimate the total amount of debt accumulated from mid-2009 to mid-2019.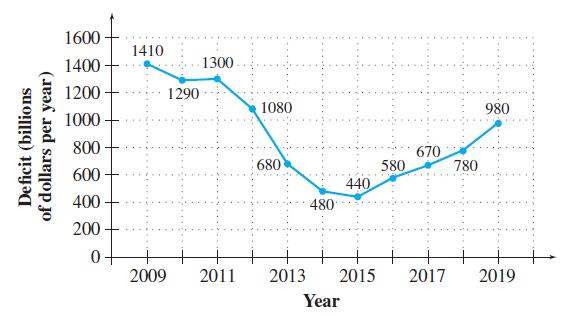
Fantastic news! We've Found the answer you've been seeking!
Step by Step Answer:
The total amount of ...View the full answer

Answered By
Pranav Makode
I am a bachelor students studying at professor ram meghe institute of technology and research. I have a great experience of being an expert. I have worked as an expert at helloexperts and solvelancer as a part time job. I have also worked as a doubt solver at ICAD SCHOOL OF LEARNING, which is in Amravati city. I have also worked as an Freelancer.
I have great experience of helping students, as described above. I can help any students in a most simple and understandable way. I will not give you have any chance for complaint. You will be greatfull to accept me as an expert.
1+ Reviews
10+ Question Solved
Related Book For 

Question Posted:
