

The graph below shows the discharge of water (in cubic feet per second) from the Otter Creek
Question:
The graph below shows the discharge of water (in cubic feet per second) from the Otter Creek in Middlebury, VT, during March 2019. Sketch a graph of the rate of change in the discharge with respect to time.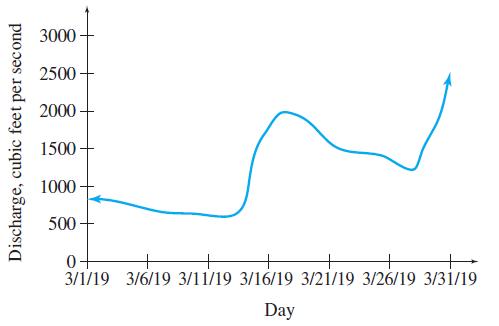
Fantastic news! We've Found the answer you've been seeking!
Step by Step Answer:
Rate of change of d...View the full answer

Answered By
Diane Joyce Pastorin
Please accept my enthusiastic application to solutioninn. I would love the opportunity to be a hardworking, passionate member of your tutoring program. As soon as I read the description of the program, I knew I was a well-qualified candidate for the position.
I have extensive tutoring experience in a variety of fields. I have tutored in English as well as Calculus. I have helped students learn to analyze literature, write essays, understand historical events, and graph parabolas. Your program requires that tutors be able to assist students in multiple subjects, and my experience would allow me to do just that.
You also state in your job posting that you require tutors that can work with students of all ages. As a summer camp counselor, I have experience working with preschool and kindergarten-age students. I have also tutored middle school students in reading, as well as college and high school students. Through these tutoring and counseling positions, I have learned how to best teach each age group.
2+ Reviews
10+ Question Solved
Related Book For 

Question Posted:
