

The graph in the next column shows how the number of arthropod species resistant to insecticides has
Question:
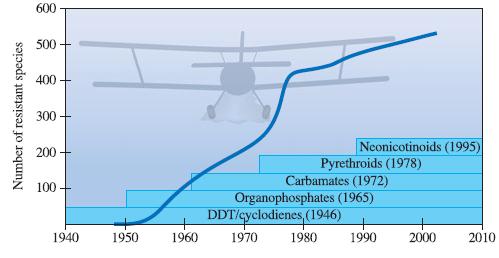
The graph in the next column shows how the number of arthropod species resistant to insecticides has varied with time. Sketch a graph of the rate of change of the insecticide–resistant species as a function of time.
Step by Step Answer:

This question has not been answered yet.
You can Ask your question!
Related Book For 

Calculus With Applications
ISBN: 9780321831101
10th Edition
Authors: Margaret L Lial, Raymond N Greenwell, Nathan P Ritchey
Question Posted:
