

The graph shows the profit from the daily production of x thousand kilograms of an industrial chemical.
Question:
The graph shows the profit from the daily production of x thousand kilograms of an industrial chemical. Use the graph to find the following limits.
(a) limx→6 P(x)
(b) limx→10- P(x)
(c) limx→10+ P(x)
(c) limx→10 P(x)
(e) Where is the function discontinuous? What might account for such a discontinuity?
(f) Use the graph to estimate the number of units of the chemical that must be produced before the second shift is as profitable as the first.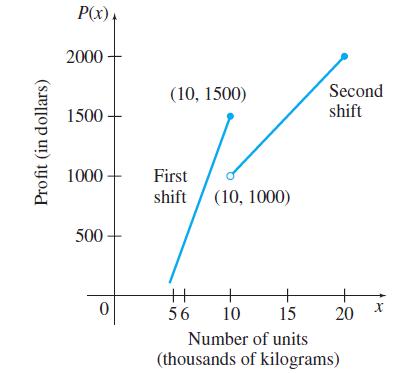
Fantastic news! We've Found the answer you've been seeking!
Step by Step Answer:
a As x approaches 6 from the left or the right the value of Px for the corresponding point ...View the full answer

Answered By
Nyron Beeput
I am an active educator and professional tutor with substantial experience in Biology and General Science. The past two years I have been tutoring online intensively with high school and college students. I have been teaching for four years and this experience has helped me to hone skills such as patience, dedication and flexibility. I work at the pace of my students and ensure that they understand.
My method of using real life examples that my students can relate to has helped them grasp concepts more readily. I also help students learn how to apply their knowledge and they appreciate that very much.
1+ Reviews
10+ Question Solved
Related Book For 

Question Posted:
