

The graph shows the temperature T in degrees Fahrenheit as a function of the altitude h in
Question:
The graph shows the temperature T in degrees Fahrenheit as a function of the altitude h in feet when an inversion layer is over Southern California. (An inversion layer is formed when air at a higher altitude, say 3000 ft, is warmer than air at sea level, even though air normally is cooler with increasing altitude.) Estimate and interpret the average rate of change in temperature for the following changes in altitude.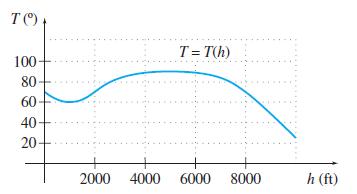
(a) 1000 to 2000 ft
(b) 1000 to 5000 ft
(c) 5000 to 8000 ft
(d) 2000 to 8000 ft
(e) At what altitude at or below 7000 ft is the temperature highest? Lowest? How would your answer change if 7000 ft is changed to 10,000 ft?
(f) At what altitude is the temperature the same as it is at 1000 ft?
Fantastic news! We've Found the answer you've been seeking!
Step by Step Answer:
a From 1000 to 3200 ft the temperature changes about 10F per 1000 ...View the full answer

Answered By
Sarfraz gull
have strong entrepreneurial and analytical skills which ensure quality tutoring and mentoring in your international business and management disciplines. Over last 3 years, I have expertise in the areas of Financial Planning, Business Management, Accounting, Finance, Corporate Finance, International Business, Human Resource Management, Entrepreneurship, Marketing, E-commerce, Social Media Marketing, and Supply Chain Management.
Over the years, I have been working as a business tutor and mentor for more than 3 years. Apart from tutoring online I have rich experience of working in multinational. I have worked on business management to project management.
3+ Reviews
10+ Question Solved
Related Book For 

Question Posted:
