

The level curves in the land areas of the accompanying figure indicate ice elevations above sea level
Question:
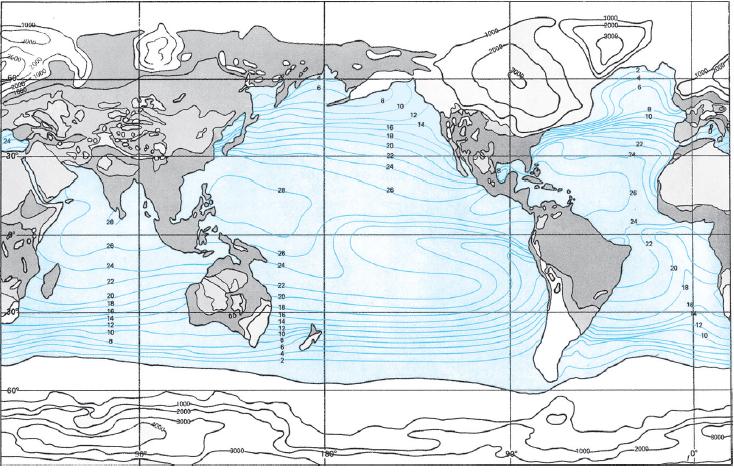
The level curves in the land areas of the accompanying figure indicate ice elevations above sea level (in meters) during the last major ice age (approximately 18,000 years ago). The level curves in the sea areas indicate sea surface temperature. For instance, the ice was 1,000 meters thick above New York City, and the sea temperature near the Hawaiian Islands was about 24 ºC. Where on earth was the ice pack the thickest? What ice-bound land area was adjacent to the warmest sea?
Fantastic news! We've Found the answer you've been seeking!
Step by Step Answer:
The ice pack was thicke...View the full answer

Answered By
Muhammad Umair
I have done job as Embedded System Engineer for just four months but after it i have decided to open my own lab and to work on projects that i can launch my own product in market. I work on different softwares like Proteus, Mikroc to program Embedded Systems. My basic work is on Embedded Systems. I have skills in Autocad, Proteus, C++, C programming and i love to share these skills to other to enhance my knowledge too.
1+ Reviews
10+ Question Solved
Related Book For 

Calculus For Business, Economics And The Social And Life Sciences
ISBN: 9780073532387
11th Brief Edition
Authors: Laurence Hoffmann, Gerald Bradley, David Sobecki, Michael Price
Question Posted:
