

The number of males per 100 females, age 65 or over, in the United States for some
Question:
The number of males per 100 females, age 65 or over, in the United States for some recent years is shown in the following table.
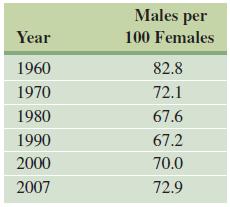
a. Plot the data, letting x be the years since 1900.
b. Would a linear or quadratic function best model this data? Explain.
c. If your graphing calculator has a quadratic regression feature, find the quadratic function that best fits the data. Graph this function on the same calculator window as the data. (See Exercise 63(c).)
d. Choose the lowest point in the table above as the vertex and (60, 82.8) as a second point to find a quadratic function defined by f(x) = a(x – h)2 + k that models the data.
e. Graph the function from part d on the same calculator window as the data and function from part c. Do the graphs of the two functions differ by much?
f. Predict the number of males per 100 females in 2004 using the two functions from parts c and d, and compare with the actual figure of 71.7.
Data from Exercises 63(c)
c. If your graphing calculator has a regression feature, find the quadratic function that best fits the data. Graph this function on the same calculator window as the data. (On a TI-84 Plus calculator, press the STAT key, and then select the CALC menu. QuadReg is item 5. The command QuadReg L1,L2,Y1 finds the quadratic regression equation for the data in L1 and L2 and stores the function in y1.)
Step by Step Answer:

This question has not been answered yet.
You can Ask your question!


Calculus With Applications
ISBN: 9780321831101
10th Edition
Authors: Margaret L Lial, Raymond N Greenwell, Nathan P Ritchey
