

The table below gives U.S. coal consumption for selected years. (a) Draw a scatterplot, letting t =
Question:
The table below gives U.S. coal consumption for selected years.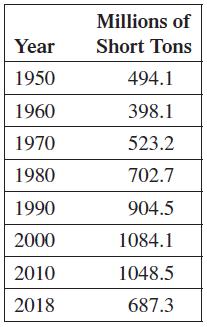
(a) Draw a scatterplot, letting t = 0 represent 1950.
(b) Use the quadratic regression feature of a graphing calculator to get a quadratic function that approximates the data.
(c) Graph the function from part (b) on the same window as the scatterplot.
(d) Use cubic regression to get a cubic function that approximates the data.
(e) Graph the cubic from part (d) on the same window as the scatterplot.
Fantastic news! We've Found the answer you've been seeking!
Step by Step Answer:
a b y 01743t2 199...View the full answer

Answered By
RADHIKA MEENAKAR
I am a qualified indian Company Secretary along with Masters in finance with over 6 plus years of professional experience. Apart from this i am a certified accounts and finance tutor on many online platforms.
My Linkedin profile link is here https://www.linkedin.com/in/radhika-meenakar-88b9808a/
12+ Reviews
22+ Question Solved
Related Book For 

Question Posted:
