

The table gives the average monthly atmospheric concentration of carbon dioxide, a major contributor to climate change,
Question:
The table gives the average monthly atmospheric concentration of carbon dioxide, a major contributor to climate change, in parts per million for December of selected years, as recorded at the Mauna Loa Observatory.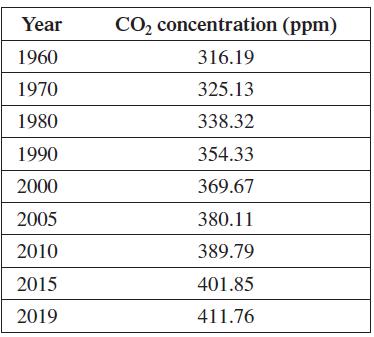 (a) Plot the data, letting t = 0 correspond to 1960. Discuss whether a linear or exponential function is a better model for the growth of CO2 concentration.
(b) Find an exponential function in the form ƒ(t) = f0at that fits these data at 1960 and 2019, where t is the number of years since 1960 and ƒ(t) is the CO2 concentration.
(c) Approximate the average annual increase in the CO2 concentration during this time period.
(d) Graph ƒ(t) and estimate the first year when CO2 concentration will be double what it was in 1960 if the current trend continues.
Step by Step Answer:
a The emissions appear to grow exponentially b c 100...View the full answer


