

The U.S. consumer price index (CPI, or cost of living index) has risen over the years, as
Question:
The U.S. consumer price index (CPI, or cost of living index) has risen over the years, as shown in the table below, using an index in which the average over the years 1982 to 1984 is set to 100. In Exercise 69 of Section 1.1, we modeled this increase with a linear function. In this exercise, we explore using nonlinear models for these data.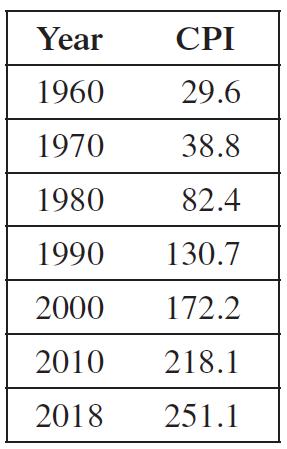
(a) Letting t be the years since 1960, write an exponential function in the form ƒ(t) = ƒ0 at that fits the data at 1960 and 2018.
(b) If your calculator has an exponential regression feature, find the best-fitting exponential function for the data.
(c) Use a graphing calculator to plot the answers to parts (a) and (b) on the same axes as the data. Are the answers to parts (a) and (b) close to each other?
(d) If your calculator has a quadratic and cubic regression feature, find the best-fitting quadratic and cubic functions for the data.
(e) Use a graphing calculator to plot the answers to parts (b) and (d) on the same window as the data. Discuss the extent to which any one of these functions models the data better than the others.
Data from Exercise 69 of Section 1.1
The Consumer Price Index (CPI) is a measure of the change in the cost of goods over time. The index was 100 for the three-year period centered on 1983. For simplicity, we will assume that the CPI was exactly 100 in 1983. Then the CPI of 251.1 in 2018 indicates that an item that cost $1.00 in 1983 would cost $2.51 in 2018. The CPI has been increasing approximately linearly over the last few decades.
Step by Step Answer:
a y a t Let Y 0 296 the value of y at t 0 Use the point 58 ...View the full answer


