

Three scatter graphs are shown below. Data is collected for three different investigations. These are: (i) The
Question:
Three scatter graphs are shown below.
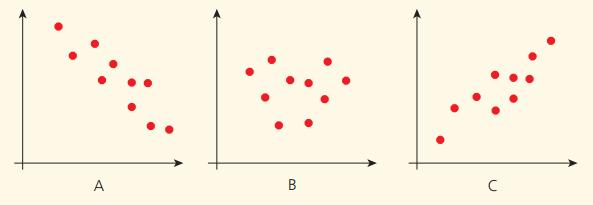
Data is collected for three different investigations. These are:
(i) The number of ice-creams sold per hour by an ice-cream vendor and the temperature during that hour
(ii) Pupils’ maths test results and their English test results
(iii) The value of a car and its age.
a. Match each scatter graph to the likely data from each investigation. Justify your choices.
b. Describe three different investigations which you think are likely to produce similar scatter graphs to the ones shown above. Justify your choices.
Fantastic news! We've Found the answer you've been seeking!
Step by Step Answer:
a To match each scatter graph to the likely data from each investigation we should look for patterns in the scatter graphs that would correspond to wh...View the full answer

Answered By
Branice Buyengo Ajevi
I have been teaching for the last 5 years which has strengthened my interaction with students of different level.
1+ Reviews
10+ Question Solved
Related Book For 
Cambridge Checkpoint Lower Secondary Mathematics Student's Book 7
ISBN: 9781398301948
3rd Edition
Authors: Frankie Pimentel, Ric Pimentel, Terry Wall
Question Posted:
