

Each of the following graphs represents an inequality. Name the inequality y. yA 6- 4 b 5-
Question:
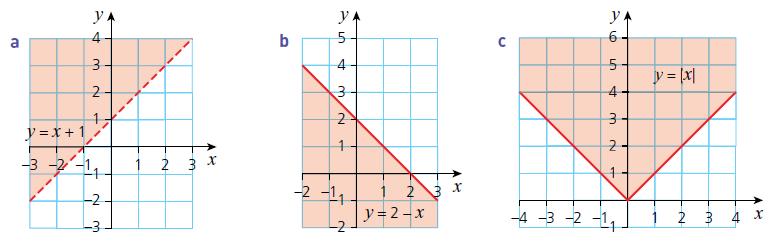
Each of the following graphs represents an inequality. Name the inequality
Fantastic news! We've Found the answer you've been seeking!
Step by Step Answer:
a The shaded region represents the inequality y x 1 as when the poin...View the full answer

Answered By
Gloria Joseph
Hi,
I am a tutor in Mathematics subject. I love learning and teaching too. I understand that each student is unique and hence I need to change myself - while communicating with each one of the students - so as to make the activity of learning a play thing, once and then for ever!
I believe in activity-based learning, with the help of tools/games/students participating in events- especially outdoor ones. I also believe in continuous learning and teaching to keep myself up to date!
Cheers!!
0 Reviews
10+ Question Solved
Related Book For 
Cambridge IGCSE And O Level Additional Mathematics
ISBN: 9781510421646
1st Edition
Authors: Val Hanrahan, Jeanette Powell
Question Posted:
