

The sketch graph shows the curve of y = x 5 x 3 . Find: a.
Question:
The sketch graph shows the curve of y = x5 − x3.
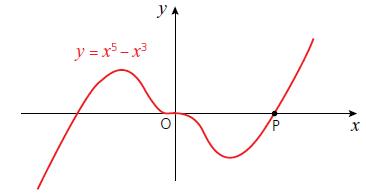
Find:
a. The coordinates of the point P where the curve crosses the positive x-axis
b. The equation of the tangent at P
c. The equation of the normal at P.
The tangent at P meets the y-axis at Q and the normal meets the y-axis at R.
d. Find the coordinates of Q and R and hence find the area of triangle PQR.
Fantastic news! We've Found the answer you've been seeking!
Step by Step Answer:
a The curve crosses the positive xaxis where y 0 Therefore we need to solve the equation x5 x3 0 for ...View the full answer

Answered By
Mary Boke
I have teached the student upto class 12th as well as my fellow mates.I have a good command in engineering,maths and science.I scored 90+ marks in 10th and 12th in maths.
0 Reviews
10+ Question Solved
Related Book For 
Cambridge IGCSE And O Level Additional Mathematics
ISBN: 9781510421646
1st Edition
Authors: Val Hanrahan, Jeanette Powell
Question Posted:
