

The diagram shows the graph of a. State the range of f . b. Find an expression
Question:
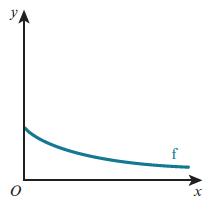
The diagram shows the graph of
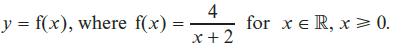
a. State the range of f .
b. Find an expression for f−1(x).
c. State the domain and range of f−1.
d. On a copy of the diagram, sketch the graph of y = f−1(x), making clear the relationship between the graphs.
Fantastic news! We've Found the answer you've been seeking!
Step by Step Answer:
a The range of f is 0 4 since x is greater than or equal to 0 and the minimum value of fx is 402 2 w...View the full answer

Answered By
User l_917591
As a Business Management graduate from Moi University, I had the opportunity to work as a tutor for undergraduate students in the same field. This experience allowed me to apply the theoretical knowledge I had gained in a practical setting, while also honing my teaching and communication skills.
As a tutor, I was responsible for conducting tutorial sessions, grading assignments and exams, and providing feedback and support to my students. I also assisted with the preparation of course materials and collaborated with other tutors and professors to ensure consistency in teaching and assessment.
0 Reviews
10+ Question Solved
Related Book For 
Cambridge International AS And A Level Mathematics Pure Mathematics 1 Coursebook
ISBN: 9781108407144
1st Edition
Authors: Sue Pemberton, Julian Gilbey
Question Posted:
