

The following table shows the cumulative frequencies for values of x. Without drawing a cumulative frequency graph,
Question:
The following table shows the cumulative frequencies for values of x.
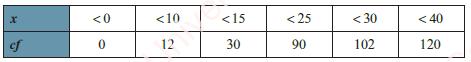
Without drawing a cumulative frequency graph, find:
a. The interquartile range
b. The 85th percentile.
Fantastic news! We've Found the answer you've been seeking!
Step by Step Answer:
Here is the table of x and cumulative frequency cf x 0 10 15 25 30 40 cf 0 12 30 90 102 120 a The in...View the full answer

Answered By
Mary Boke
I have teached the student upto class 12th as well as my fellow mates.I have a good command in engineering,maths and science.I scored 90+ marks in 10th and 12th in maths.
0 Reviews
10+ Question Solved
Related Book For 

Cambridge International AS & A Level Mathematics Probability & Statistics 1 Coursebook
ISBN: 9781108407304
1st Edition
Authors: Dean Chalmers, Julian Gilbey
Question Posted:
