

Fit the RC model to Table 9.3. Interpret the estimated scores. Does it fit better than the
Question:
Fit the RC model to Table 9.3. Interpret the estimated scores. Does it fit better than the uniform association model?
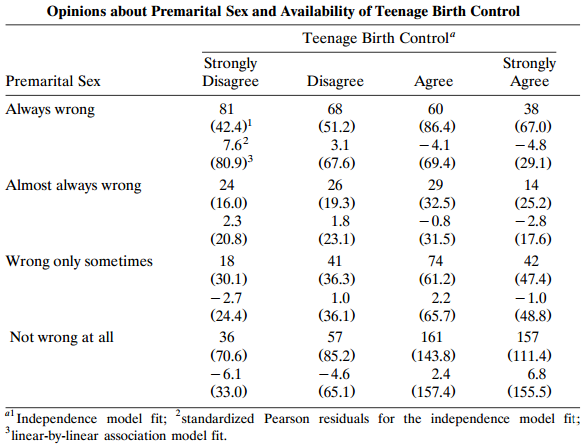
Table 9.3:
Fantastic news! We've Found the answer you've been seeking!
Step by Step Answer:
ANSWER The RC model is a type of item response theory model that assumes that each item has a diffi...View the full answer

Answered By
Collins Njuguna
I graduated from Maseno University with a Bachelor of Science in Applied Statistics. After graduation, I started tutoring students in mathematics. My experience in mathematics education is extensive and varied. I have taught a wide range of topics, including algebra, geometry, trigonometry, calculus, statistics, probability, and computer science. I have also worked with students of all ages and backgrounds, from elementary school to college.
My teaching method is based on the idea of hands-on learning. I believe that students learn best when they are actively engaged in the learning process, so I focus on giving students the tools they need to explore the material on their own. I also emphasize the importance of practice and review, as these are essential for mastering math concepts.
I have also developed several online and in-person courses on mathematics. My courses are designed to help students learn mathematics in an efficient and comprehensive way, and I use a variety of activities and exercises to ensure that my students are engaged and motivated.
Overall, my passion for mathematics and teaching has allowed me to be a successful tutor and educator in the field. I am confident that my experience will help your students master the mathematics they need to succeed.
0 Reviews
10+ Question Solved
Related Book For 
Question Posted:
