

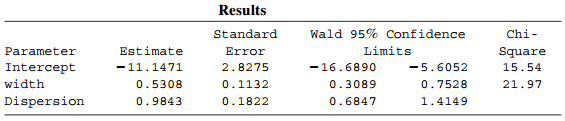
For the counts of horseshoe-crab satellites in Table 4.3, Table 13.10 shows the results of ML fitting
Question:
a. State and interpret the prediction equation.
b. Show that at a predicted µÌ‚, the estimated variance is roughly µÌ‚ + µÌ‚2.
c. The corresponding Poisson GLM has fit µÌ‚ = €“11.53 + 0.55x (SE = 0.06). Compare 95% confidence intervals for the slopes for the two models. Interpret, and indicate whether overdispersion seems to exist relative to the Poisson GLM.
Table 4.3
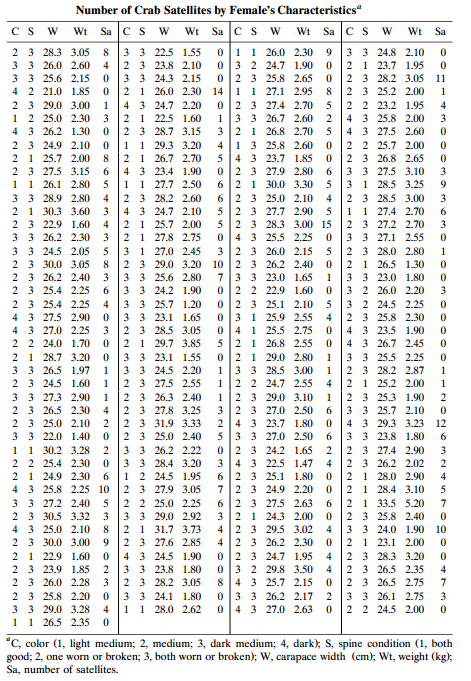
Table 13.10
Fantastic news! We've Found the answer you've been seeking!
Step by Step Answer:
a 1115 53x b The estimated dispersion parameter 98 so the est...View the full answer

Answered By
Shameen Tahir
The following are details of my Areas of Effectiveness. The following are details of my Areas of Effectiveness English Language Proficiency, Organization Behavior , consumer Behavior and Marketing, Communication, Applied Statistics, Research Methods , Cognitive & Affective Processes, Cognitive & Affective Processes, Data Analysis in Research, Human Resources Management ,Research Project,
Social Psychology, Personality Psychology, Introduction to Applied Areas of Psychology,
Behavioral Neurosdence , Historical and Contemporary Issues in Psychology, Measurement in Psychology, experimental Psychology,
Business Ethics Business Ethics An introduction to business studies Organization & Management Legal Environment of Business Information Systems in Organizations Operations Management Global Business Policies Industrial Organization Business Strategy Information Management and Technology Company Structure and Organizational Management Accounting & Auditing Financial Accounting Managerial Accounting Accounting for strategy implementation Financial accounting Introduction to bookkeeping and accounting Marketing Marketing Management Professional Development Strategies Business Communications Business planning Commerce & Technology Human resource management General Management Conflict management Leadership Organizational Leadership Supply Chain Management Law Corporate Strategy Creative Writing Analytical Reading & Writing Other Expertise Risk Management Entrepreneurship Management science Organizational behavior Project management Financial Analysis, Research & Companies Valuation And any kind of Excel Queries.
16+ Reviews
34+ Question Solved
Related Book For 
Question Posted:
