

Table 3.13 shows the results of a retrospective study comparing radiation therapy with surgery in treating cancer
Question:
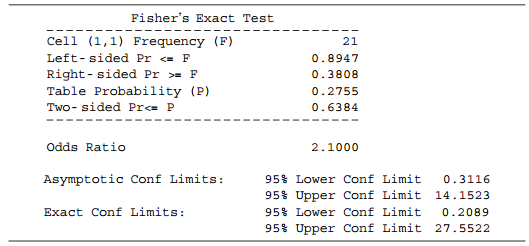
a. Report and interpret the P-value for Fisher€™s exact test with (i) Hα: θ > 1, and (ii) Hα: 0 ‰ 1. Explain how the P-values are calculated.
b. Interpret the confidence intervals for θ. Explain the difference between them and how they were calculated.
c. Find and interpret the one-sided mid-P-value. Give advantages and disadvantages of this type of P-value.
Table 3.13:
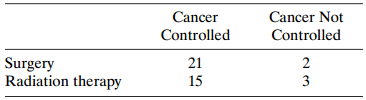
Table 3.14:
Fantastic news! We've Found the answer you've been seeking!
Step by Step Answer:
a It is plausible that control of cancer Is independent of tr...View the full answer

Answered By
Shubhradeep Maity
I am an experienced and talented freelance writer passionate about creating high-quality content. I have over five years of experience working in the field and have collaborated with several renowned companies and clients in the SaaS industry.
At Herman LLC, an online collective of writers, I generated 1,000+ views on my content and created journal content for 100+ clients on finance topics. My efforts led to a 60% increase in customer engagement for finance clients through revamping website pages and email interaction.
Previously, at Gerhold, a data management platform using blockchain, I wrote and published over 50 articles on topics such as Business Finance, Scalability, and Financial Security. I managed four writing projects concurrently and increased the average salary per page from $4 to $7 in three months.
In my previous role at Bernier, I created content for 40+ clients within the finance industry, increasing sales by up to 40%.
I am an accomplished writer with a track record of delivering high-quality content on time and within budget. I am dedicated to helping my clients achieve their goals and providing exceptional results.
1+ Reviews
10+ Question Solved
Related Book For 

Question Posted:
