

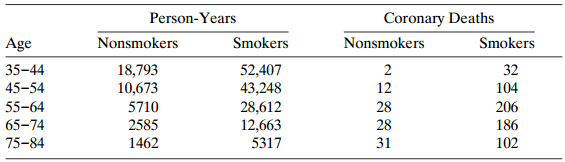
Table 9.19 is based on a study with British doctors. a. For each age, find the sample
Question:
a. For each age, find the sample coronary death rates per 1000 person-years for nonsmokers and smokers. To compare them, take their ratio and describe its dependence on age.
b. Fit a main-effects model for the log rates having four parameters for age and one for smoking. In discussing lack of fit, show that this model assumes a constant ratio of nonsmokers€™ to smokers€™ coronary death rates over age.
c. From part (a), explain why it is sensible to add a quantitative interaction of age and smoking. For this model, show that the log ratio of coronary death rates changes linearly with age. Assign scores to age, fit the model, and interpret.
Table 9.19:
Fantastic news! We've Found the answer you've been seeking!
Step by Step Answer:
a The ratio of the rate for smokers to nonsmokers decreases ...View the full answer

Answered By
Sidharth Jain
My name is Sidharth. I completed engineering from National Institute of Technology Durgapur which is one of the top college in India. I am currently working as an Maths Faculty in one of the biggest IITJEE institute in India. Due to my passion in teaching and Maths, I came to this field. I've been teaching for almost 3 years.
Apart from it I also worked as an Expert Answerer on Chegg.com. I have many clients from USA to whom I teach online and help them in their assignments. I worked on many online classes on mymathlab and webassign. I guarantee for grade 'A'.
3+ Reviews
10+ Question Solved
Related Book For 
Question Posted:
