

a. Given experimental data either for the excess Gibbs energy, G ex , or for species activity
Question:
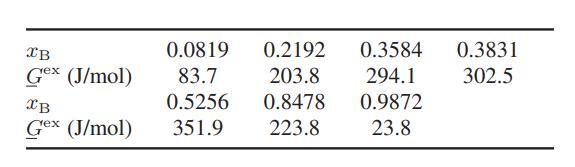
a. Given experimental data either for the excess Gibbs energy, Gex, or for species activity coefficients from which Gex can be computed, it is sometimes difficult to decide whether to fit the data to the two constant Margules or van Laar expressions for Gex and γi. One method of making this decision is to plot Gex/x1x2 versus x1 and x1x2/Gex versus x1 and determine which of the two plots is most nearly linear. If it is the first, the data are best fit with the two-constant Margules expression; if the second, the van Laar expression should be used. Justify this procedure, and suggest how these plots can be used to obtain the parameters in the activity coefficient equations.
b. The following data have been obtained for the benzene–2,2,4-trimethyl pentane mixture (Illustration 10.1-4). Using the procedure in part (a), decide which of the two solution methods is likely to best fit the data.
Step by Step Answer:
Part a The decision to fit the data to the two constant Margules or van Laar expressions for excess ...View the full answer


Chemical Biochemical And Engineering Thermodynamics
ISBN: 9780470504796
5th Edition
Authors: Stanley I. Sandler
