

By doing some simple calculations and plotting several graphs, one can verify some of the statements made
Question:
By doing some simple calculations and plotting several graphs, one can verify some of the statements made in this chapter concerning phase equilibrium and phase transitions. All the calculations should be done using the steam tables.
a. Establish, by direct calculation, that
![]()
for steam at 2.5 MPa and T = 224°C.
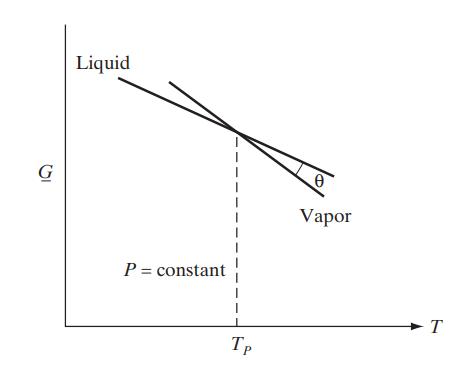
b. Calculate GV at P = 2.5 MPa for a collection of temperatures between 225 and 400°C and extrapolate this curve below 224°C.
c. Find GL at 160, 170, 180, 190, 200, and 210°C. Plot this result on the same graph as used for part (b) and extrapolate above 224°C. For a liquid H and S can be taken to be independent of pressure. Therefore, the values of H and S for the liquid at any pressure can be gotten from the data for the saturated liquid at the same temperature. How does this graph compare with Fig. 7.3-7?
Fig. 7.3-7
d. Plot V versus T at P = 2.5 MPa for the temperature range of 150 to 400°C, and show that V is discontinuous.
e. Plot CP versus T at P = 2.5 MPa over the temperature range of 150 to 400°C, and thereby establish that CP is discontinuous.
f. Using the data in the steam tables, show that the Gibbs energies per unit mass of steam and liquid water in equilibrium at 300°C are equal.
Step by Step Answer:

This question has not been answered yet.
You can Ask your question!

Chemical Biochemical And Engineering Thermodynamics
ISBN: 9780470504796
5th Edition
Authors: Stanley I. Sandler
