

In experiments with standard solutions, (mathrm{a} mathrm{Li}^{+})ISE gave a calibration curve of [E=0.39+(0.0577) log left[mathrm{Li}^{+}ight]] An analyst
Question:
In experiments with standard solutions, \(\mathrm{a} \mathrm{Li}^{+}\)ISE gave a calibration curve of
\[E=0.39+(0.0577) \log \left[\mathrm{Li}^{+}ight]\]
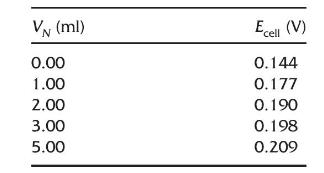
An analyst assumed that the sensitivity of the ISE (represented by the coefficient of the log term) is the same in urine samples as it was in the standard solutions, but that differences in the activity coefficient and junction potential were too great to use the calibration curve to determine the \(\left[\mathrm{Li}^{+}ight]\)in urine samples. She decided to perform a standard additions experiment. Here are the data. Use a Gran plot of the data to determine the original \(\left[\mathrm{Li}^{+}ight]\)in the urine sample. Increments of \(0.0788 \mathrm{M}\) standard Li were added to \(50.0 \mathrm{~mL}\) of sample.
Step by Step Answer:
VN10mEcell Recall that VoVN x 10m cell CVVN 10Eenst Plot VoVN10m cell ver sus VN where m 100577 The ...View the full answer


Electroanalytical Chemistry Principles Best Practices And Case Studies
ISBN: 9781119538592,9781119538585
1st Edition
Authors: Gary A. Mabbott
