

The following are measured values of a system temperature versus time: (a) Use the method of least
Question:
The following are measured values of a system temperature versus time:
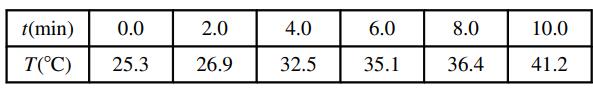
(a) Use the method of least squares Appendix A.1 to fit a straight line to the data, showing your calculations. You may use a spreadsheet to evaluate the formulas in Appendix A.1, but do not use any plotting or statistical functions. Write the derived formula for T(t), and convert it to a formula for t(T).
(b) Transfer the data into two columns on an Excel spreadsheet, putting the t data (including the heading) in Cells A1–A7 and the T data (including the heading) in B1–B7. Following instructions for your version of Excel, insert a plot of T versus t into the spreadsheet, showing only the data points and not putting lines or curves between them. Then add a linear trendline to the plot (that is, fit a straight line to the data using the method of least squares) and instruct Excel to show the equation of the line and the R 2 value. The closer R 2 is to 1, the better the fit.
Appendix A.1

Step by Step Answer:
0 253 5 329 5 76 25 38 2 269 5 329 3 6 9 1...View the full answer


Elementary Principles of Chemical Processes
ISBN: 978-1119498759
4th edition
Authors: Richard M. Felder, Ronald W. Rousseau, Lisa G. Bullard
