

Curves A, B, and C in Figure P15-4A show the variations in reaction rate for three different
Question:
Curves A, B, and C in Figure P15-4A show the variations in reaction rate for three different reactions catalyzed by solid catalyst pellets. What can you say about each reaction?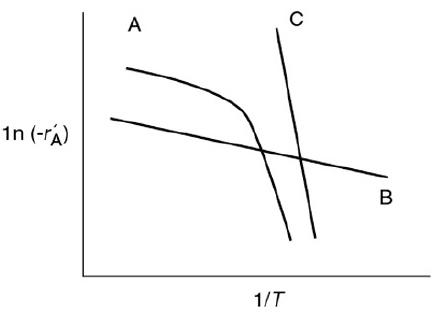
Temperature dependence of three reactions. In the graph, the vertical axis represents natural log of (negative r prime subscript A) and the horizontal axis represents 1 over T. The reaction rate of A decreases gradually until a point and falls rapidly, reaction rate of B decreases gradually, and reaction rate of C decreases rapidly. While, B and C show a linear decrease, A shows a non-linear decrease.
Fantastic news! We've Found the answer you've been seeking!
Step by Step Answer:
Curve A At low temperatures high 1T the reaction is rate limited as evi...View the full answer

Answered By
Nazrin Ziad
I am a post graduate in Zoology with specialization in Entomology.I also have a Bachelor degree in Education.I posess more than 10 years of teaching as well as tutoring experience.I have done a project on histopathological analysis on alcohol treated liver of Albino Mice.
I can deal with every field under Biology from basic to advanced level.I can also guide you for your project works related to biological subjects other than tutoring.You can also seek my help for cracking competitive exams with biology as one of the subjects.
2+ Reviews
10+ Question Solved
Related Book For 

Question Posted:
