

The curve shown in Figure 2-1 is typical of a reaction carried out isothermally, and the curve
Question:
The curve shown in Figure 2-1 is typical of a reaction carried out isothermally, and the curve shown in Figure P2-10C is typical of a gas–solid catalytic exothermic reaction carried out adiabatically.
Figure 2-1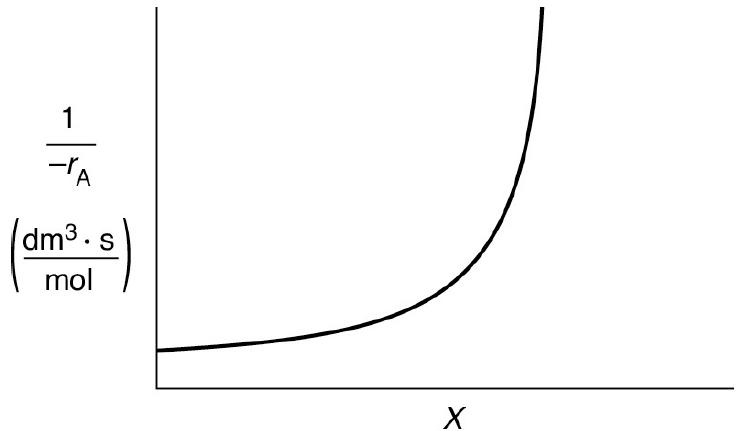
Figure P2-10C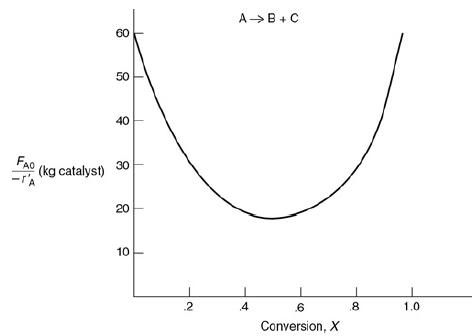
Levenspiel plot for an adiabatic exothermic heterogeneous reaction. A Levenspiel plot compares the weight of catalyst with conversion values. The horizontal axis represents the conversion ranging from 0 to 1.0 in increments of 0.2. The vertical axis represents catalyst weight with molar flow rate as F subscript A0, ranging from 10 to 60 in increments of 10. The curve is a parabola open upwards. The vertex of the parabola is at (0.5,18) and the parabola passes through (0,60). Note: All values taken are approximate.
a. Assuming that you have a fluidized CSTR and a PBR containing equal weights of catalyst, how should they be arranged for this adiabatic reaction? Use the smallest amount of catalyst weight to achieve 80% conversion of A.
b. What is the catalyst weight necessary to achieve 80% conversion in a fluidized CSTR?
c. What fluidized CSTR weight is necessary to achieve 40% conversion?
d. What PBR weight is necessary to achieve 80% conversion?
e. What PBR weight is necessary to achieve 40% conversion?
f. Plot the rate of reaction and conversion as a function of PBR catalyst weight, W. Additional information: FA0 = 2 mol/s.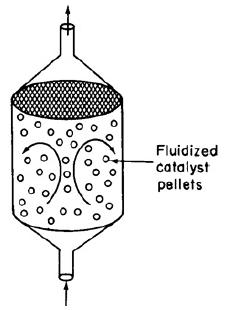
Step by Step Answer:
a The smallest amount of catalyst necessary to achieve 80 conversion in a CSTR and PBR connected in ...View the full answer


