

Examine the graph in Figure 1.14 and answer each question. (a) What was the concentration of carbon
Question:
Examine the graph in Figure 1.14 and answer each question.
(a) What was the concentration of carbon dioxide in 1960?
(b) What was the concentration in 2010?
(c) How much did the concentration increase between 1960 and 2010?
(d) What is the average rate of increase over this time?
(e) If the average rate of increase from part d remains constant, estimate the carbon dioxide concentration in 2050. (Use the concentration in 2010 as your starting point.)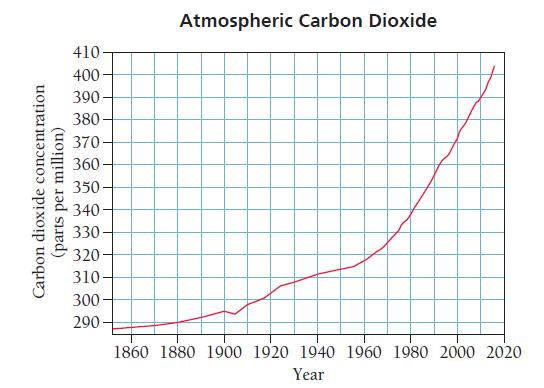
Fantastic news! We've Found the answer you've been seeking!
Step by Step Answer:
a To determine the concentration of carbon dioxide in 1960 draw a verti cal line at the year 1960 At the point where the vertical line intersects the ...View the full answer

Answered By
Muhammad Umair
I have done job as Embedded System Engineer for just four months but after it i have decided to open my own lab and to work on projects that i can launch my own product in market. I work on different softwares like Proteus, Mikroc to program Embedded Systems. My basic work is on Embedded Systems. I have skills in Autocad, Proteus, C++, C programming and i love to share these skills to other to enhance my knowledge too.
1+ Reviews
10+ Question Solved
Related Book For 
Question Posted:
