

The accompanying graph shows the concentration of a reactant as a function of time for two different
Question:
The accompanying graph shows the concentration of a reactant as a function of time for two different reactions. One of the reactions is first order, and the other is second order. Which of the two reactions is first order? Second order? How would you change each plot to make it linear?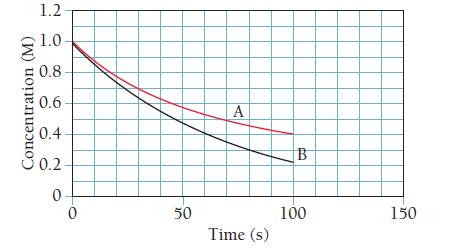
Fantastic news! We've Found the answer you've been seeking!
Step by Step Answer:
B is first order and A is ...View the full answer

Answered By
Joseph Mwaura
I have been teaching college students in various subjects for 9 years now. Besides, I have been tutoring online with several tutoring companies from 2010 to date. The 9 years of experience as a tutor has enabled me to develop multiple tutoring skills and see thousands of students excel in their education and in life after school which gives me much pleasure. I have assisted students in essay writing and in doing academic research and this has helped me be well versed with the various writing styles such as APA, MLA, Chicago/ Turabian, Harvard. I am always ready to handle work at any hour and in any way as students specify. In my tutoring journey, excellence has always been my guiding standard.
1+ Reviews
10+ Question Solved
Related Book For 
Question Posted:
