

The graph shows the distribution of molecular velocities for the same molecule at two different temperatures (T
Question:
The graph shows the distribution of molecular velocities for the same molecule at two different temperatures (T1 and T2). Which temperature is greater? Explain.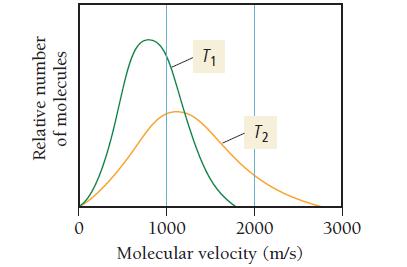
Fantastic news! We've Found the answer you've been seeking!
Step by Step Answer:
The temperature T2 is greater In a MaxwellBoltzmann distribution of molecular velocities the p...View the full answer

Answered By
Muhammad Umair
I have done job as Embedded System Engineer for just four months but after it i have decided to open my own lab and to work on projects that i can launch my own product in market. I work on different softwares like Proteus, Mikroc to program Embedded Systems. My basic work is on Embedded Systems. I have skills in Autocad, Proteus, C++, C programming and i love to share these skills to other to enhance my knowledge too.
1+ Reviews
10+ Question Solved
Related Book For 
Question Posted:
