

The following chart shows a general decline in abundance with increasing mass among the first 30 elements.
Question:
The following chart shows a general decline in abundance with increasing mass among the first 30 elements. The decline continues beyond zinc. Notice that the scale on the vertical axis is logarithmic, that is, it progresses in powers of 10. The abundance of nitrogen, for example, is 1/10,000 (1/104) of the abundance of hydrogen. All abundances are plotted as the number of atoms per 1012 atoms of H. (The fact that the abundances of Li, Be, and B, as well as those of the elements near Fe, do not follow the general decline is a consequence of the way that elements are synthesized in stars.) 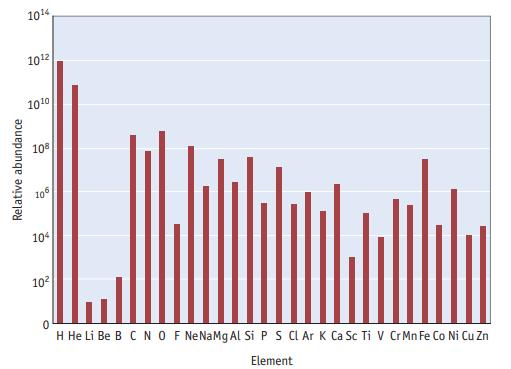
(a). What is the most abundant main group metal?
(b). What is the most abundant nonmetal?
(c). What is the most abundant metalloid?
(d). Which of the transition elements is most abundant?
(e). Which halogens are included on this plot, and which is the most abundant?
Step by Step Answer:
a What is the most abundant main group metal The most abundant main group metal is iron Fe b What is ...View the full answer


Chemistry And Chemical Reactivity
ISBN: 9780357001172
10th Edition
Authors: John C. Kotz, Paul M. Treichel, John Townsend, David Treichel
