

The accompanying graph shows plots of ln k versus 1/T for two different reactions. The plots have
Question:
The accompanying graph shows plots of ln k versus 1/T for two different reactions. The plots have been extrapolated to the y-intercepts. Which reaction (red or blue) has
(a) The larger value for Ea
(b) The larger value for the frequency factor, A?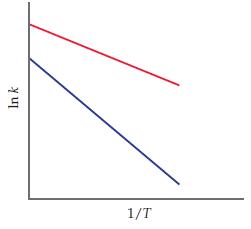
Fantastic news! We've Found the answer you've been seeking!
Step by Step Answer:
a As per Arrhenius equation relation between rate constant and ...View the full answer

Answered By
Ankit Mahajan
I am an electrical engineering graduate from Thapar institute of engineering and technology.
Qualified exams - GATE 2019,2020.
CAT EXAM 2021- 91.4 percentile
SSC EXAMS- 2019,2020,2021
AFCAT EXAM- 2019,2020,2021
I want to share my knowledge with other people so that they can achieve the same.
I have strong hold Mathematics, Electrical engineering and all the subjects related.
Just give me a problem and I will give you the solution of it.
1+ Reviews
10+ Question Solved
Related Book For 

Chemistry The Central Science
ISBN: 9780321910417
13th Edition
Authors: Theodore E. Brown, H. Eugene LeMay, Bruce E. Bursten, Catherine Murphy, Patrick Woodward, Matthew E. Stoltzfus
Question Posted:
