Question:
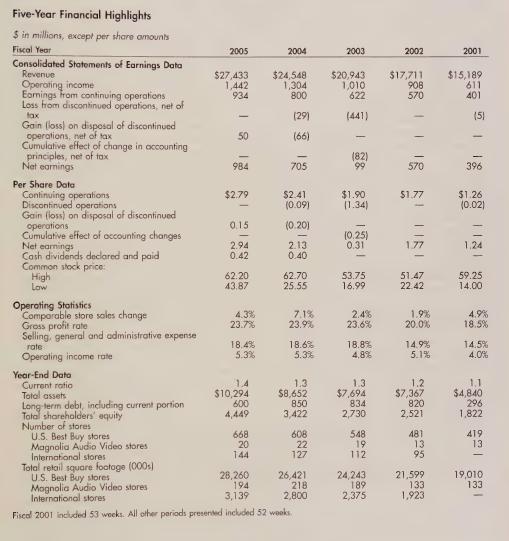
Refer to the financial statements of Best Buy in Appendix A near the end of the book. Look at the cad consolidated statements of earnings (income statement).How many years are included and what are their dates?
Transcribed Image Text:
Five-Year Financial Highlights $ in millions, except per share amounts Fiscal Year Consolidated Statements of Earnings Data Revenue Operating income Eomings from continuing operations Loss from discontinued operations, net of fax Gain (loss) on disposal of discontinued 2005 2004 2003 2002 2001 $27,433 $24,548 $20,943 $17,711 $15,189 1,442 1,304 1,010 908 611 934 800 622 570 401 (29) (441) (5) operations, net of tax 50 (66) - Cumulative effect of change in accounting principles, net of tax (82) Nat earnings 984 705 99 570 396 Per Share Data Continuing operations $2.79 $2.41 $1.90 $1.77 $1.26 Discontinued operations (0.09) (1.34) (0.02) Gain (loss) on disposal of discontinued operations 0.15 (0.20) Cumulative effect of accounting changes (0.25) Net earnings 2.94 2.13 0.31 1.77 1.24 Cash dividends declared and paid 0.42 0.40 Common stock price: High 62.20 62.70 53.75 51.47 59.25 Low 43.87 25.55 16.99 22.42 14.00 Operating Statistics Comparable store sales change 4.3% 7.1% 2.4% 1.9% Gross profit rate 23.7% 23.9% 23.6% 20.0% Selling, general and administrative expense rate 18.4% 18.6% 18.8% 14.9% Operating income rate 5.3% 5.3% 4.8% 5.1% Year-End Data Current ratio 1.4 1.3 1.3 1.2 Total assets $10,294 $8,652 $7,694 $7,367 Long term debt, including current portion 600 850 834 820 Total shareholders' equity Number of stores U.S. Best Buy stores Magnolia Audio Video stores International stores U.S. Best Buy stores Magnolia Audio Video stores International stores 4,449 3,422 2,730 2,521 668 608 548 481 20 22 19 13 144 127 112 95 ) 4.0% Total retail square footage (000s) 28,260 194 3,139 26,421 24,243 218 2,800 189 2,375 21,599 133 1,923 19,010 133 Fiscal 2001 included 53 weeks. All other periods presented included 52 weeks.