

a. The figure shows the intersections of a number of one-way streets. The numbers given represent traffic
Question:
a. The figure shows the intersections of a number of one-way streets. The numbers given represent traffic flow at a peak period (from 4 p.m. to 5:30 p.m.). Use the figure to write a linear system of six equations in seven variables based on the idea that at each intersection the number of cars entering must equal the number of cars leaving.
b. Use a graphing utility with a ref or rref command to find the complete solution to the system.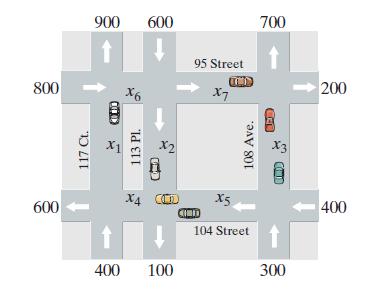
Fantastic news! We've Found the answer you've been seeking!
Step by Step Answer:
a b The matrix for the system is From left to right along 95th Street th...View the full answer

Answered By
Utsab mitra
I have the expertise to deliver these subjects to college and higher-level students. The services would involve only solving assignments, homework help, and others.
I have experience in delivering these subjects for the last 6 years on a freelancing basis in different companies around the globe. I am CMA certified and CGMA UK. I have professional experience of 18 years in the industry involved in the manufacturing company and IT implementation experience of over 12 years.
I have delivered this help to students effortlessly, which is essential to give the students a good grade in their studies.
2+ Reviews
10+ Question Solved
Related Book For 

Question Posted:
