

Exercises 23 and 24: Use the table to make a scatterplot and line graph of the data.
Question:
Exercises 23 and 24: Use the table to make a scatterplot and line graph of the data.
Atmospheric CO2 Levels (parts per million)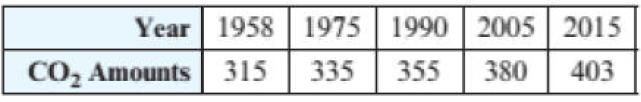
Fantastic news! We've Found the answer you've been seeking!
Step by Step Answer:
CO levels ppm 450 400 350 300 250 200 150 1...View the full answer

Answered By
Qurat Ul Ain
Successful writing is about matching great style with top content. As an experienced freelance writer specialising in article writing and ghostwriting, I can provide you with that perfect combination, adapted to suit your needs.
I have written articles on subjects including history, management, and finance. Much of my work is ghost-writing, so I am used to adapting to someone else's preferred style and tone. I have post-graduate qualifications in history, teaching, and social science, as well as a management diploma, and so am well equipped to research and write in these areas.
265+ Reviews
421+ Question Solved
Related Book For 

College Algebra With Modeling And Visualization
ISBN: 9780134418049
6th Edition
Authors: Gary Rockswold
Question Posted:
