

Exercises 8991 present data in the form of tables. For each data set shown by the table,
Question:
Exercises 89–91 present data in the form of tables. For each data set shown by the table,
a. Create a scatter plot for the data.
b. Use the scatter plot to determine whether an exponential function, a logarithmic function, or a linear function is the best choice for modeling the data.
Number of Jobs in the U.S. Solar-Energy Industry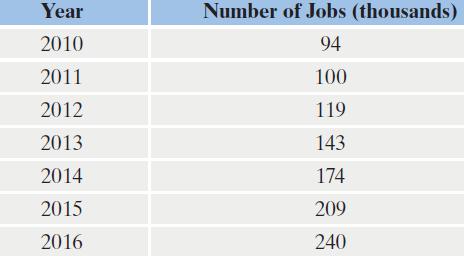
Fantastic news! We've Found the answer you've been seeking!
Step by Step Answer:
a b An exponential function appears to be the bette...View the full answer

Answered By
Amit Choudhary
I'm new in this profession regarding online teaching but previously i used to teach students near my college. I am teaching on online platform since last year and got good support from the students. I'm teaching on platforms like chegg and vedantu and also at my home in free time.
1+ Reviews
10+ Question Solved
Related Book For 

Question Posted:
