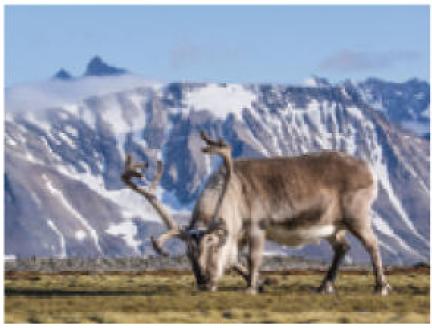
For all types of animals, the percentage that survive into the next year decreases. In one study,
Question:
For all types of animals, the percentage that survive into the next year decreases. In one study, the survival rate of a sample of reindeer was modeled by S(t) = 100(0.999993)t5. The function S outputs the percentage of reindeer that survive t years.
(a) Evaluate S(4) and S(15). Interpret the results.
(b) Graph Sin [0, 15, 5] by [0, 110, 10]. Interpret the graph. Does the graph have a horizontal asymptote?
Fantastic news! We've Found the answer you've been seeking!
Step by Step Answer:
Related Book For 

College Algebra With Modeling And Visualization
ISBN: 9780134418049
6th Edition
Authors: Gary Rockswold
Question Posted:


