

Group members should develop appropriate functions that model each of the projections shown in Exercise 45. Data
Question:
Group members should develop appropriate functions that model each of the projections shown in Exercise 45.
Data from exercise 45
AIDS is taking a deadly toll on southern Africa. Describe how to use the techniques that you learned in this section to obtain a model for African life span using projections with AIDS, shown by the red graph in the figure. Let x represent the number of years after 1985 and let y represent African life span in that year.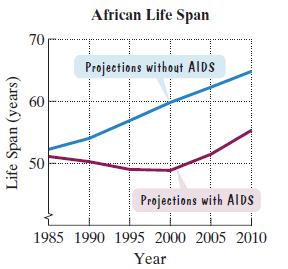
Fantastic news! We've Found the answer you've been seeking!
Step by Step Answer:
To model the African life span based on the given graph we need to use regression techniques to deve...View the full answer

Answered By
Muhammad Umair
I have done job as Embedded System Engineer for just four months but after it i have decided to open my own lab and to work on projects that i can launch my own product in market. I work on different softwares like Proteus, Mikroc to program Embedded Systems. My basic work is on Embedded Systems. I have skills in Autocad, Proteus, C++, C programming and i love to share these skills to other to enhance my knowledge too.
1+ Reviews
10+ Question Solved
Related Book For 

Question Posted:
