

In Example 1, we used two data points and an exponential function to model the population of
Question:
In Example 1, we used two data points and an exponential function to model the population of the United States from 1970 through 2010. The data are shown again in the table. Use all five data points to solve Exercises 66–70.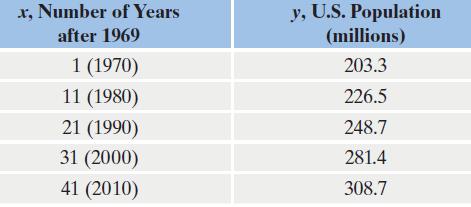
Data from example 1
The graph in Figure 4.22 shows the U.S. population, in millions, for five selected years from 1970 through 2010. In 1970, the U.S. population was 203.3 million. By 2010, it had grown to 308.7 million.
Figure 4.22
Use your graphing utility’s logarithmic regression option to obtain a model of the form y = a + b ln x that fits the data. How well does the correlation coefficient, r, indicate that the model fits the data?
Fantastic news! We've Found the answer you've been seeking!
Step by Step Answer:
The logarithmic model is ...View the full answer

Answered By
Muhammad Ghyas Asif
It is my obligation to present efficient services to my clients by providing a work of quality, unique, competent and relevant. I hope you have confidence in me and assign me the order and i promise to follow all the instructions and keep time.
109+ Reviews
203+ Question Solved
Related Book For 

Question Posted:
