

In Example 1, we used two data points and an exponential function to model the population of
Question:
In Example 1, we used two data points and an exponential function to model the population of the United States from 1970 through 2010. The data are shown again in the table. Use all five data points to solve Exercises 66–70.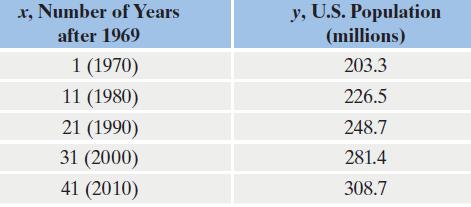
Data from example 1
The graph in Figure 4.22 shows the U.S. population, in millions, for five selected years from 1970 through 2010. In 1970, the U.S. population was 203.3 million. By 2010, it had grown to 308.7 million.
Figure 4.22
a. Use your graphing utility’s exponential regression option to obtain a model of the form y = abx that fits the data. How well does the correlation coefficient, r, indicate that the model fits the data?
b. Rewrite the model in terms of base e. By what percentage is the population of the United States increasing each year?
Step by Step Answer:
a The exponential model is y 20121011x Since ...View the full answer


